Screenshots
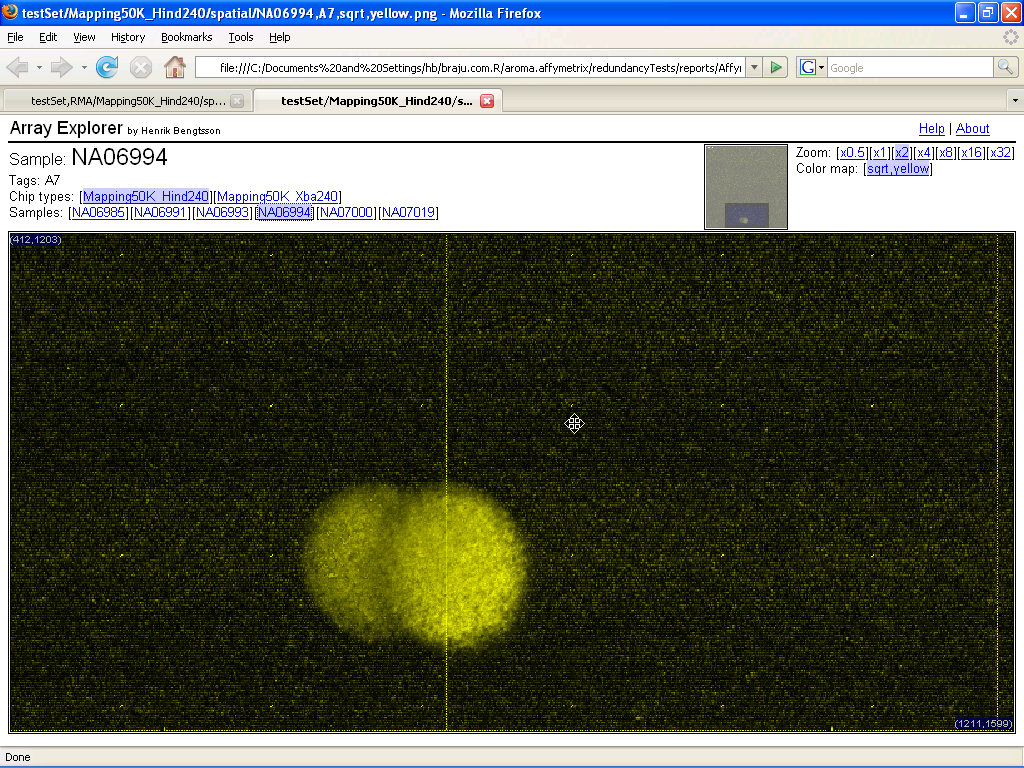
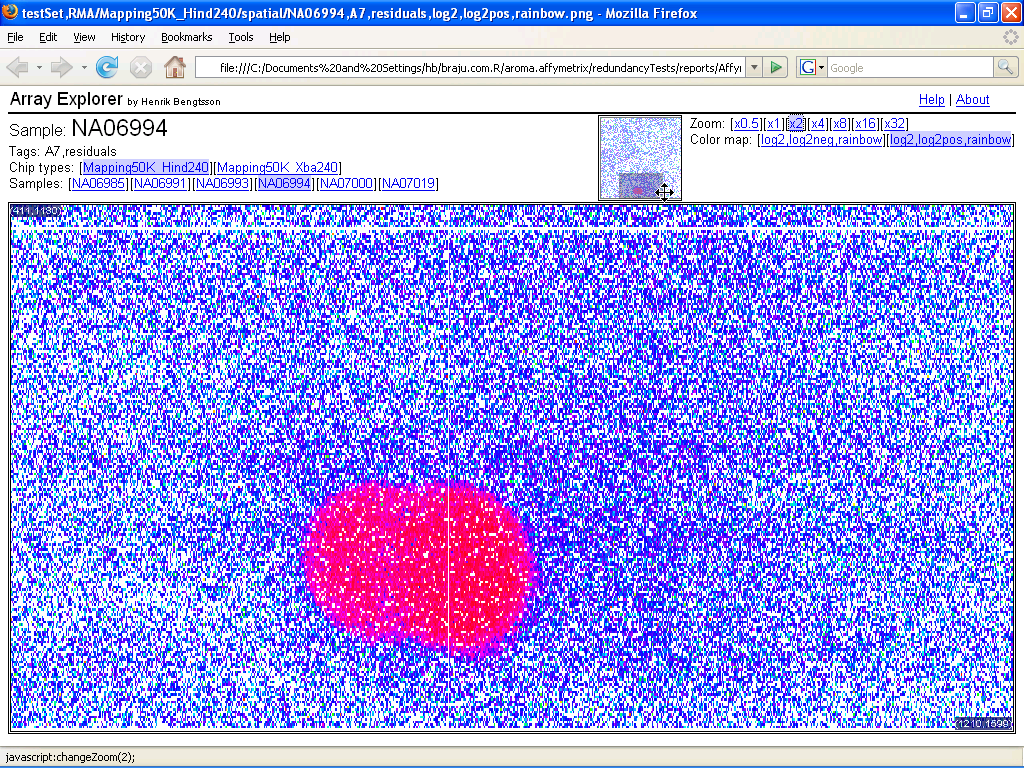
Figure: ArrayExplorer showing spatial data. Left: Raw probe intensities of a Mapping50K_Hind240 array. Right: Residuals from the same area and array obtained by fitting a log-additive probe level model across six arrays.
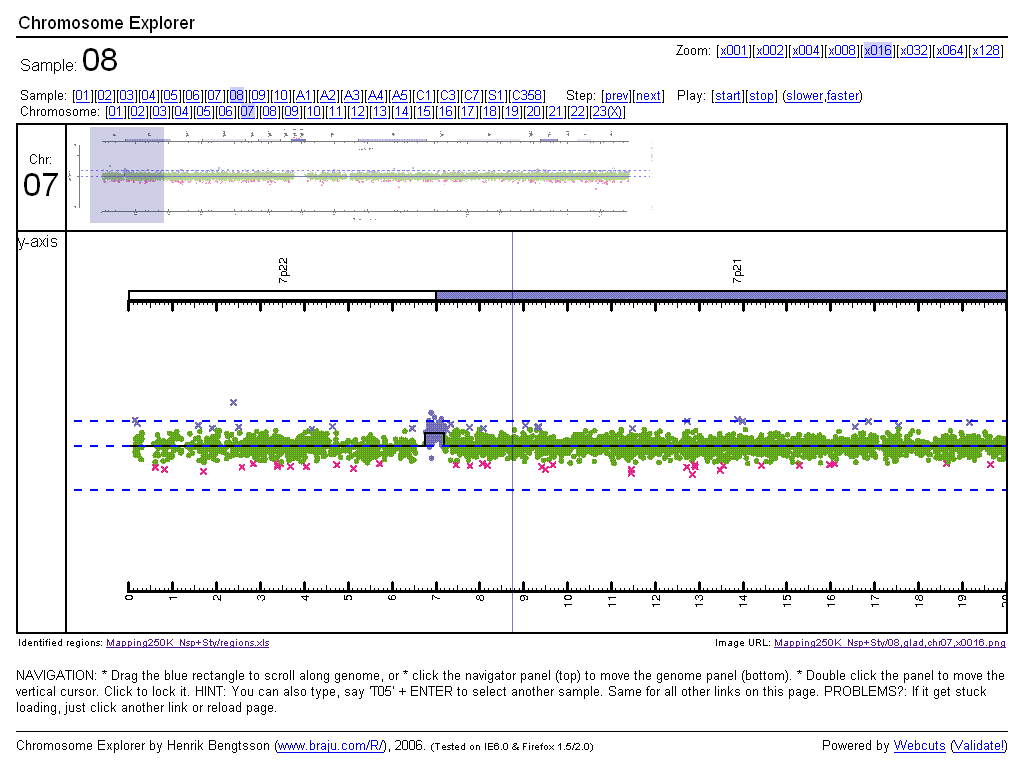
Figure: ChromosomeExplorer displaying a copy-number amplification detected by the GLAD method.