Vignette: Paired parent-specific copy-number segmentation (Paired PSCBS) (low-level API after ASCRMA v2)
Author: Henrik Bengtsson
Created on: 2011-11-11
Last modified: 2011-11-16
This document describes how to do parent-specific copy-number (PSCN) analysis on a tumor-normal pair of Affymetrix SNP microarray data. We will use the two samples GSM318736 (tumor) and GSM318737 (matched normal) from the GEO GSE12702 data set. Processing the two CEL files using allele-specific CRMA v2 (Bengtsson, Wirapati, and Speed, 2009) we obtain PSCN estimates (total CNs and allele B fractions), which we pass to the Paired PSCBS (Olshen, Bengtsson, Neuvial, Spellman, Olshen, and Seshan, 2011) method for PSCN segmentation. The Paired PSCBS method is implemented in the PSCBS package.
Setup Affymetrix data set
Here we assume that the two CEL files GSM318736.CEL and GSM318737.CEL have been downloaded from GEO (GSE12702) and placed in rawData/GSE12702/Mapping250K_Nsp/.
library("aroma.affymetrix")
verbose <- Arguments$getVerbose(-10, timestamp=TRUE)

dataSet <- "GSE12702"
chipType <- "Mapping250K_Nsp"

# Load all samples (in case more samples were downloaded)
csR <- AffymetrixCelSet$byName(dataSet, chipType=chipType)

# Extract tumor-normal pair of interest
pair <- c(T="GSM318736", N="GSM318737")
csR <- csR[indexOf(csR, pair)]
print(csR)
AffymetrixCelSet:
Name: GSE12702
Tags:
Path: rawData,shared/GSE12702/Mapping250K_Nsp
Platform: Affymetrix
Chip type: Mapping250K_Nsp
Number of arrays: 2
Names: GSM318736, GSM318737 [2]
Time period: 2008-04-04 14:07:29 -- 2008-04-04 14:39:34
Total file size: 125.31MB
RAM: 0.01MB

AffymetrixCelSet:
Name: GSE12702
Tags:
Path: rawData,shared/GSE12702/Mapping250K_Nsp
Platform: Affymetrix
Chip type: Mapping250K_Nsp
Number of arrays: 2
Names: GSM318736, GSM318737 [2]
Time period: 2008-04-04 14:07:29 -- 2008-04-04 14:39:34
Total file size: 125.31MBRAM: 0.01MB
Allele-specific copy-number estimates
Here we will use an allele-specific version of CRMA v2 to estimate total CNs (TCNs) and allele B fractions (BAFs) from the two CEL files. ASCRMA v2 will take care of signal normalization etc:
res <- doASCRMAv2(csR, verbose=verbose)
This will take a couple of minutes per array.
Extracting PSCN estimates for the tumor-normal pair
Next we need to extract TCNs and BAFs for the tumor and the matched normal:
# Extract (total,beta) estimates for the tumor-normal pair
data <- extractPSCNArray(res$total)
dimnames(data)[[3]] <- names(pair)
str(data)
Actually, at this stage the TCNs have not been standardized toward a reference. Here we will calculate TCNs as C = 2*T/N where T and N are the total "CN" signals for the tumor and the matched normal, respectively.
# Total CNs for the tumor relative to the matched normal
CT <- 2 * (data[,"total","T"] / data[,"total","N"])

# Allele B fractions for the tumor
betaT <- data[,"fracB","T"]

# Allele B fractions for the normal
betaN <- data[,"fracB","N"]
What is remaining is to get the genomic locations for these data points:
# Get (chromosome, position) annotation data
ugp <- getAromaUgpFile(res$total)
chromosome <- ugp[,1,drop=TRUE]
x <- ugp[,2,drop=TRUE]
We now have all the PSCN data we need:
# Setup data structure for Paired PSCBS
df <- data.frame(chromosome=chromosome, x=x, CT=CT, betaT=betaT, betaN=betaN)
which contains:
     chromosome         x       CT     betaT      betaN
...
1001         15 100400215 1.686268 0.5567425 0.59335160
1002         18  51550359 2.167417 0.9406555 0.93372589
1003          4  40121562 1.810851 0.2814923 0.19477251
1004         18  20042465 1.812769 0.4044166 0.40466994
1005         10  63520698 1.727487 0.8081594 0.89995509
1006         14  67613392 1.956600 0.1247703 0.09398306
1007         22  26759177 1.331436 0.1420923 0.07435846
1008          8  14652812 2.712408 0.5142247 0.53429753
1009          5  60094266 1.546932 0.6880291 0.85552192
1010         17  45479446 1.917579 0.5122939 0.52952594
...
Parent-specific copy-number segmentation
We next use Paired PSCBS to segment the above PSCN estimates:
library("PSCBS")
fit <- segmentByPairedPSCBS(df, verbose=verbose)
Note that this may take several minutes (per tumor-normal pair).
To access the table of identified segments, use the getSegments() method,
which returns a data.frame (so it can easily be written to file):
segs <- getSegments(fit)
print(segs)
For more details on Paired PSCBS options,
see help("segmentByPairedPSCBS", package="PSCBS").
We can plot the TCN, the decrease-of-heterozygosity (DH), and the minor-major CN estimates as follows:
pairName <- paste(pair, collapse="vs")
chrTag <- sprintf("Chr%s", seqToHumanReadable(getChromosomes(fit)))

toPNG(pairName, tags=c(chrTag, "PairedPSCBS"), width=840, aspectRatio=0.6, {
  plotTracks(fit)
})
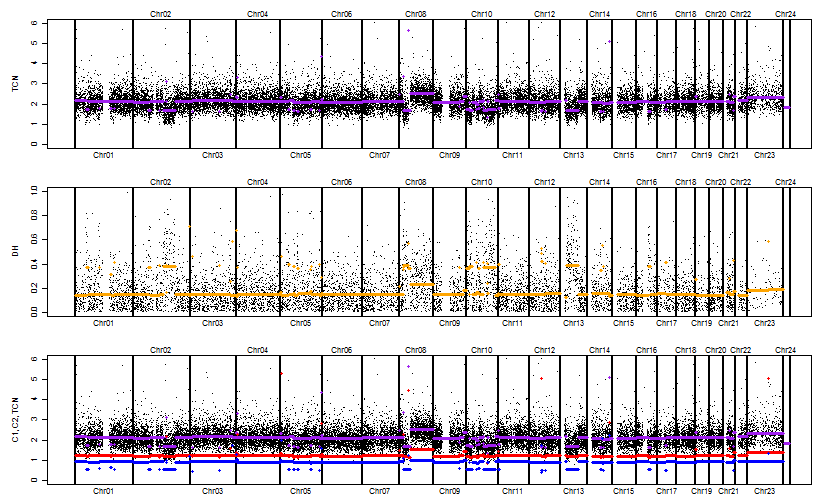
Figure. Paired PSCBS segmentation results for the GSM318736 & GSM318737 tumor-normal pair.
References
[1] H. Bengtsson, P. Wirapati, and T. P. Speed. "A single-array preprocessing method for estimating full-resolution raw copy numbers from all Affymetrix genotyping arrays including GenomeWideSNP 5 & 6". Eng. In: Bioinformatics (Oxford, England) 25.17 (Sep. 2009), pp. 2149-56. ISSN: 1367-4811. DOI: 10.1093/bioinformatics/btp371. PMID: 19535535.
[2] A. B. Olshen, H. Bengtsson, P. Neuvial, et al. "Parent-specific copy number in paired tumor-normal studies using circular binary segmentation". Eng. In: Bioinformatics (Oxford, England) 27.15 (Aug. 2011), pp. 2038-46. ISSN: 1367-4811. DOI: 10.1093/bioinformatics/btr329. PMID: 21666266.